The starting HMI problem was not a lack of data. It was the time needed to find the part that explained a production loss.
The first screen
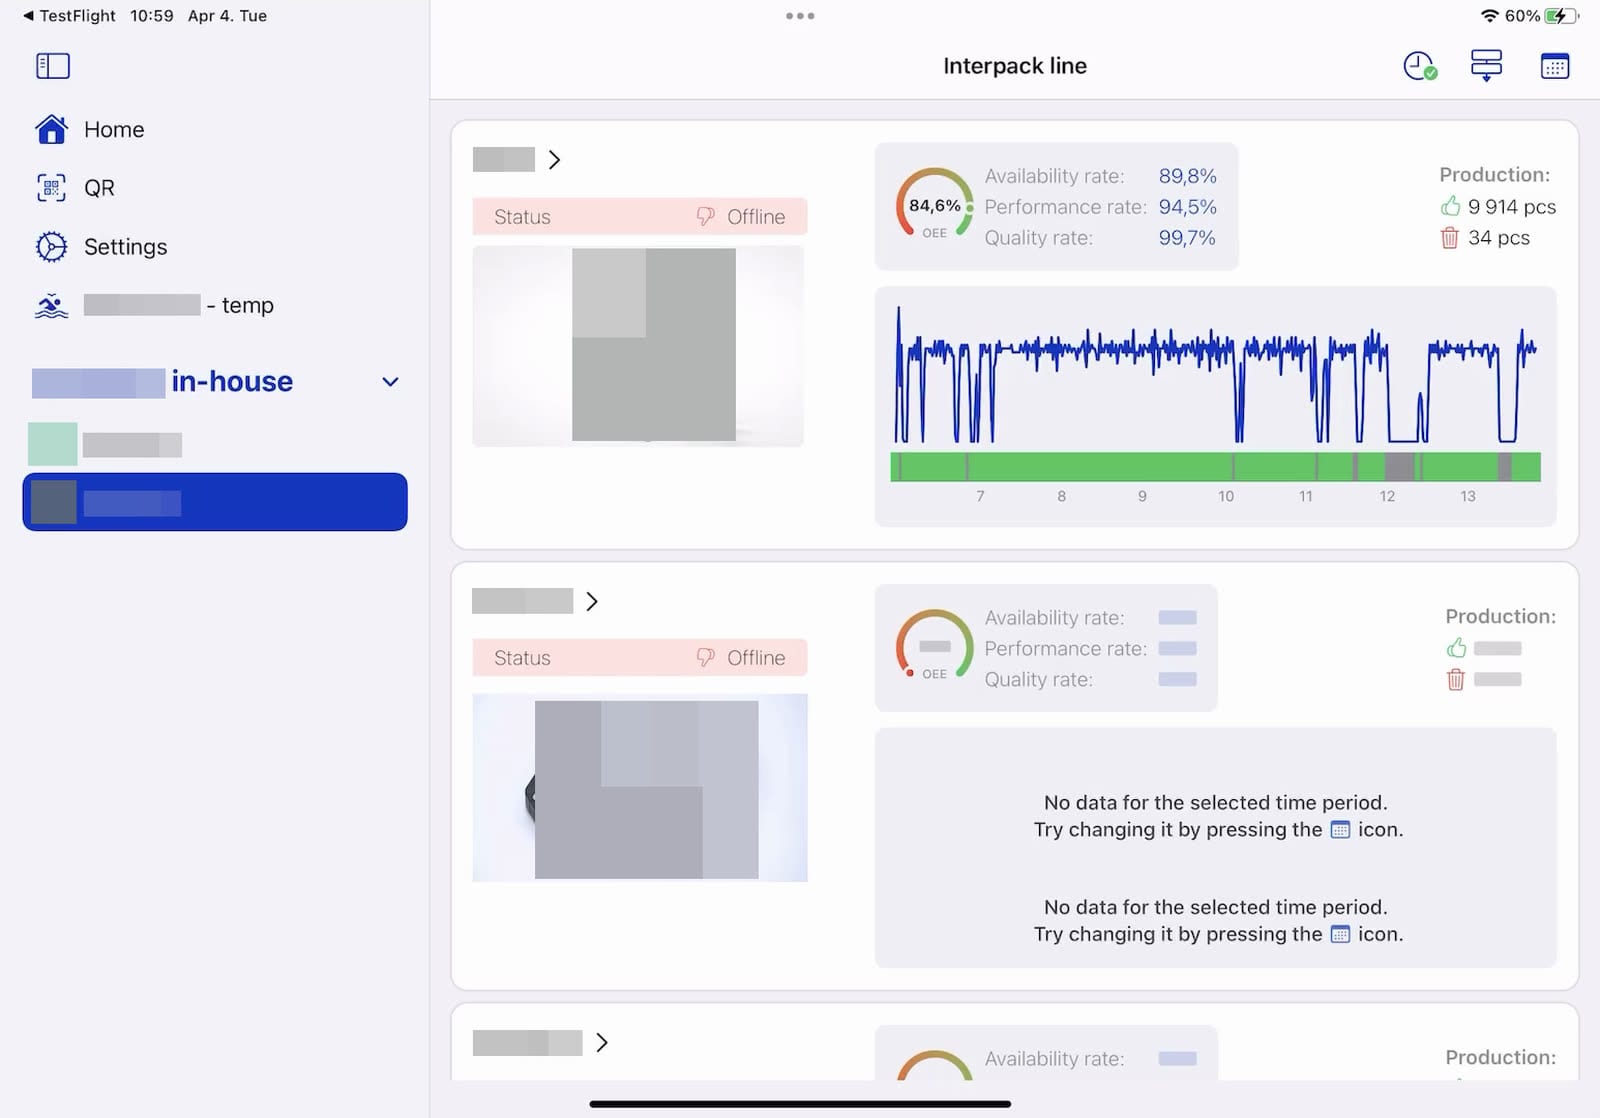
The redesigned view gives current line state and OEE components a stable place. An operator can see which part of availability, performance, or quality is moving without opening a report designed for later analysis.
Historical detail sits one step away. Selecting a loss opens the relevant events and time range rather than sending the user into a separate reporting tool with no context carried across.
Different depth for different roles
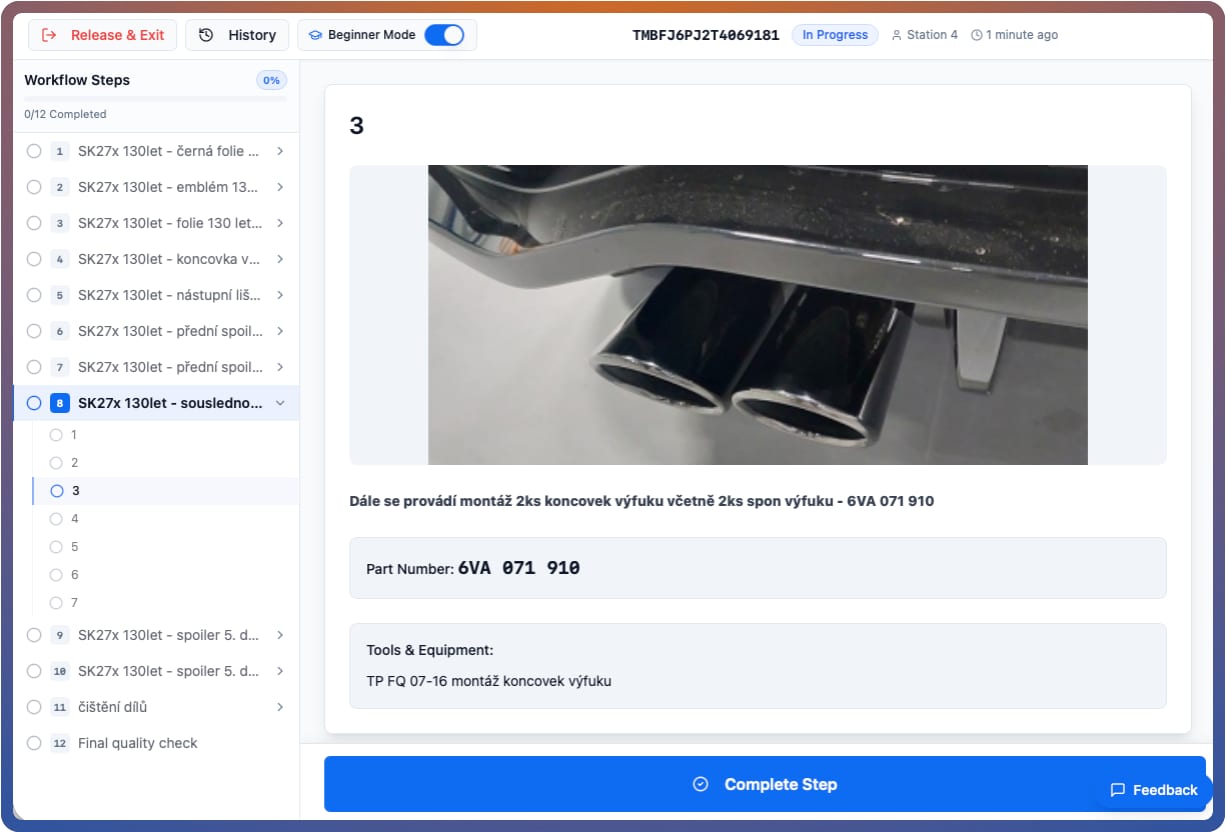
Operators need the current condition and the next permitted action. Process engineers need traceability and enough surrounding history to investigate. Management needs comparisons over time. The interface uses the same production model but does not force every role into the same screen density.
InfluxDB stores the time-series history behind the views. Production events and reporting sources are mapped so the HMI can move from a headline loss to the events that contributed to it.
The work shown here focuses on the interaction model and data path. Site-specific performance measurements are not included until they can be published with the necessary context.